2.2 Designing KPIs for Diagnosis
Even with a clear question and hypothesis, you still need to decide what to measure. KPIs turn the business question into measurable drivers and into evidence the decision-maker can actually use.
What Makes a Useful KPI
A useful KPI has two requirements.
Diagnostic. It points to where the business problem is likely coming from. A KPI may not tell you the exact action immediately, but it tells you where to investigate next. If no team can respond to the metric, it is just an observation.
Aligned with business objectives. It has a credible link to the outcome the business cares about. Correlation isn’t enough; you need to know that improving the KPI actually moves the end goal.
A common failure mode looks like this: an e-commerce team sets page views as its KPI. SEO drives up page views, but most of the new traffic does not buy, and revenue barely moves. Organic sessions to product and category pages would have been more useful, since that points the team toward traffic that is actually close to purchase.
KPI Tree: From Outcome to Drivers
A useful KPI hierarchy connects strategy to daily operations:
- KGI (Key Goal Indicator) — the ultimate business outcome (revenue, profit, market share).
- KPI (Key Performance Indicator) — the intermediate metrics that drive the KGI (new customer acquisition, repeat purchase rate, average order value).
- Action metrics — the operational levers teams control day-to-day (email send volume, ad impressions, page load speed).
This hierarchy forms a KPI tree. It breaks down the top-level outcome into the drivers that explain it. When the outcome moves, the tree tells you where to look first.
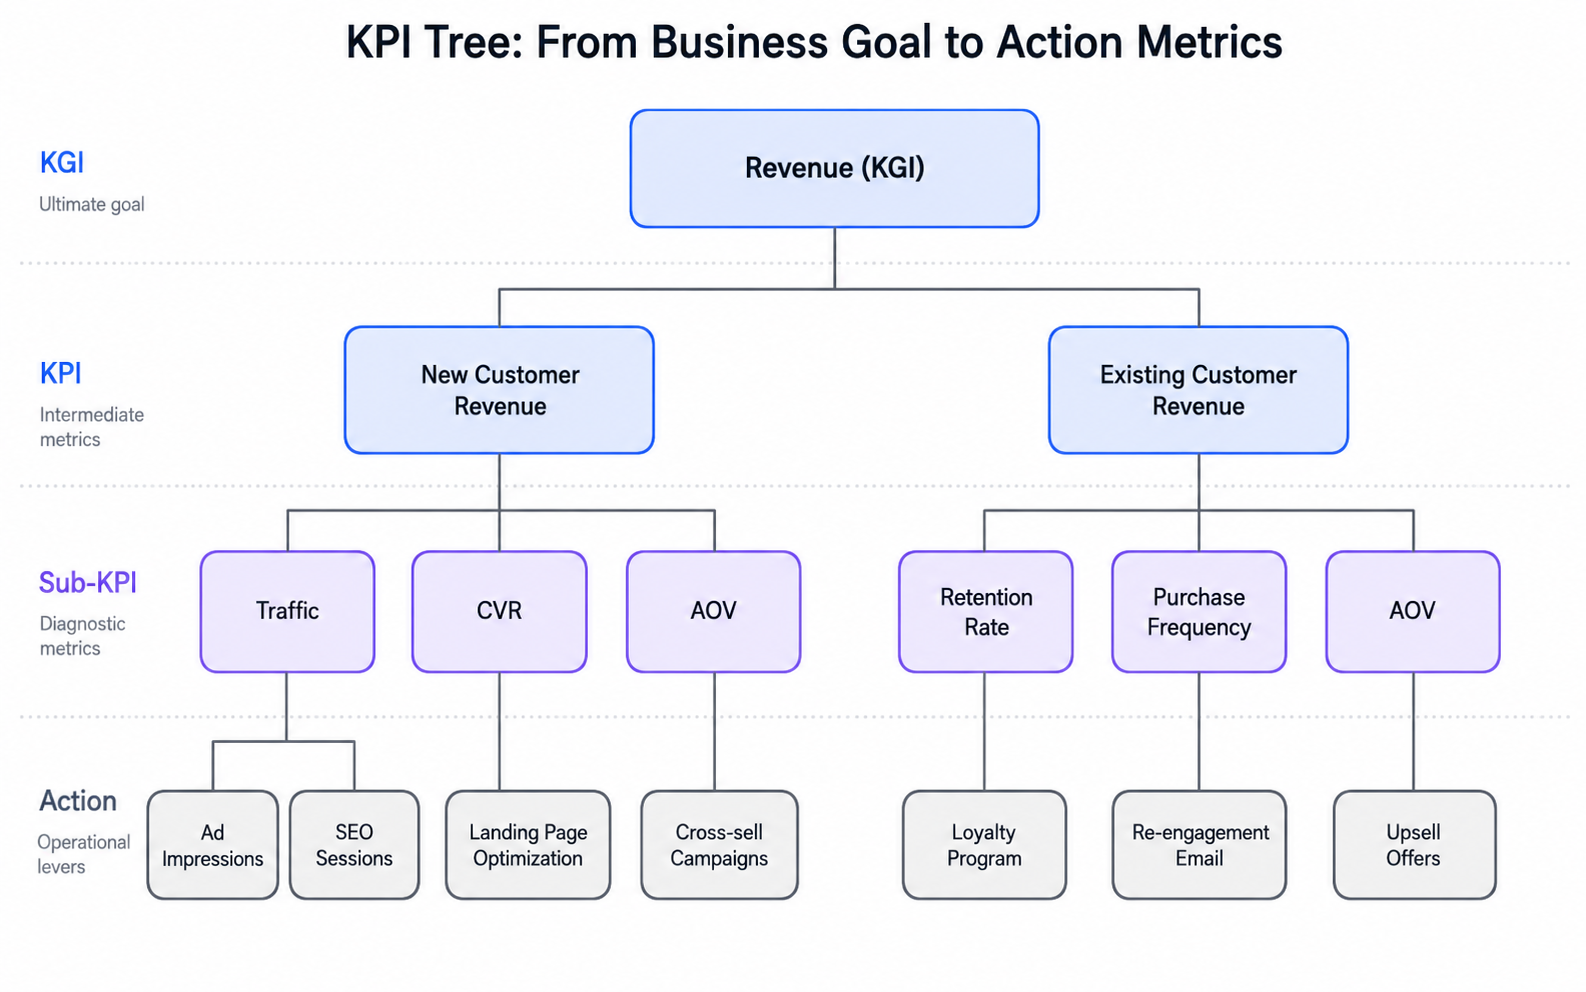
A good tree includes both lagging indicators that confirm results and leading indicators that give teams time to act.
Using the KPI Tree to Diagnose a Gap
“Can you just pull the numbers for our quarterly business review?”
This is the most common request data teams get. It sounds like a simple data pull, but it is actually a chance to add value. The difference between a report and a review is diagnosis. A report just lists numbers. A review explains why they moved and what to do next.
An effective business review follows four steps:
- Start with the top outcome. Are we on track versus plan, forecast, and last year?
- Decompose the gap. Which branch of the KPI tree explains the movement?
- Diagnose the driver. Which hypothesis best explains the gap?
- Recommend the next action. What should the owner do differently?
If you do not include diagnosis and a recommendation, a business review is just a report.
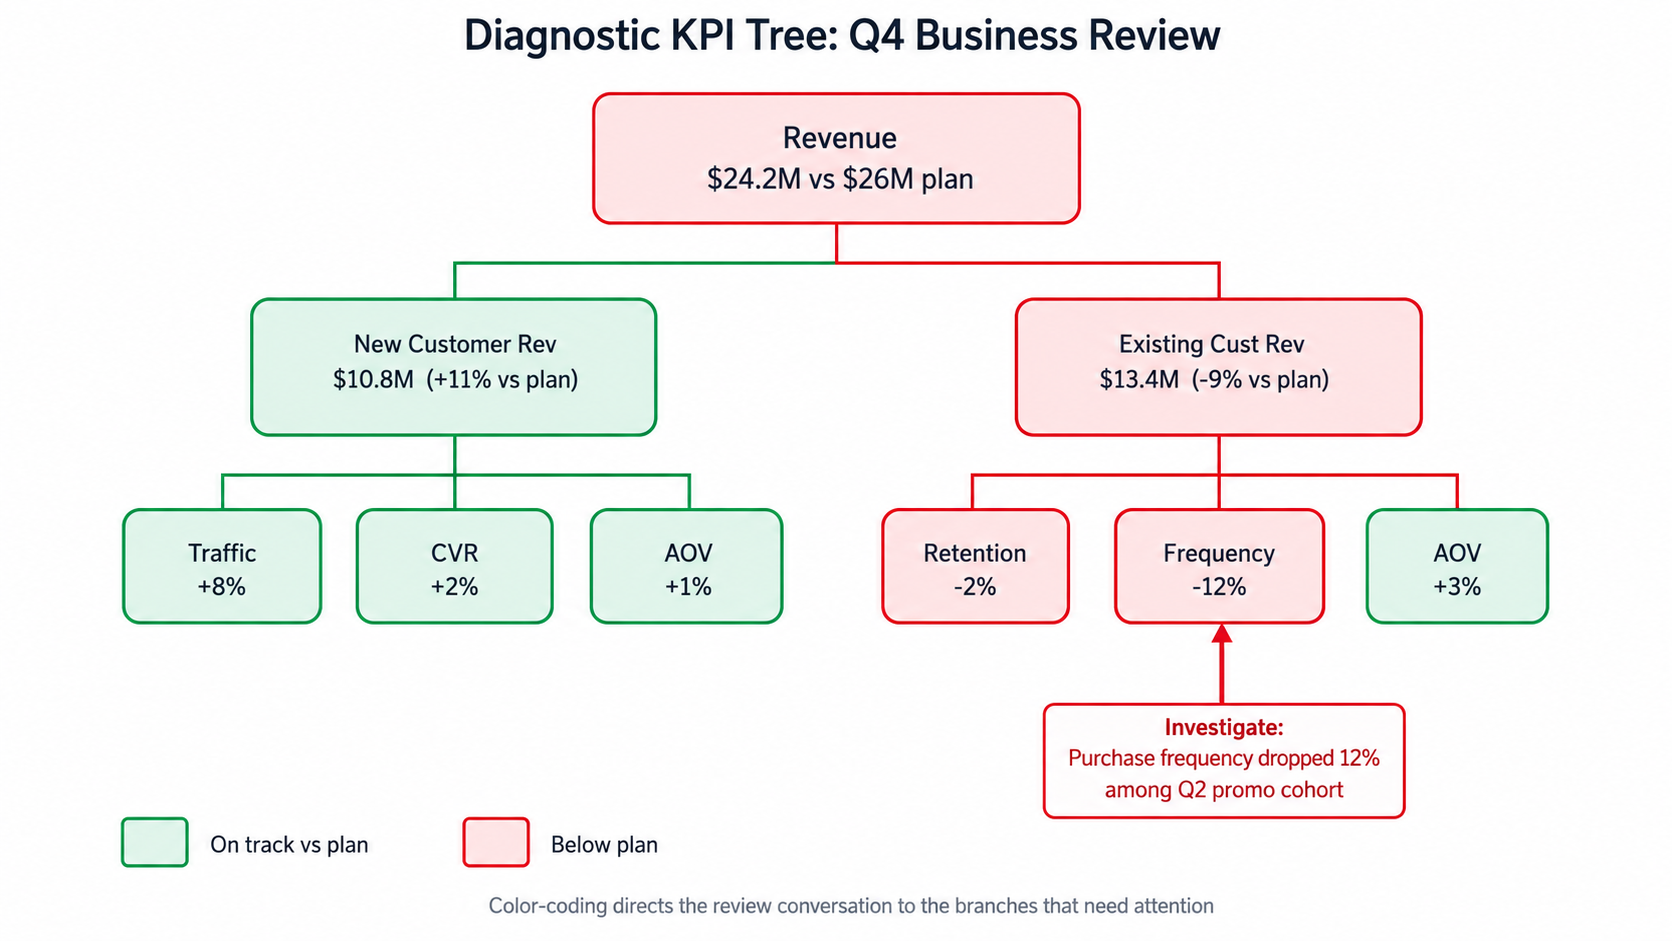
Numbers only mean something when you compare them. A single number by itself does not tell you anything. Always use at least one benchmark:
- Year-over-year (YoY) — controls for seasonality. “Revenue is down 5%” in January might be fine if it is always down in Q1.
- Versus plan/forecast — measures execution against expectations.
- Versus market/competitors — separates company-specific issues from industry-wide trends.
So far, we have covered how to start from the right question and how to measure success. The next step is how to deliver findings as a story that actually drives action.