2.3 Turning Data into Story
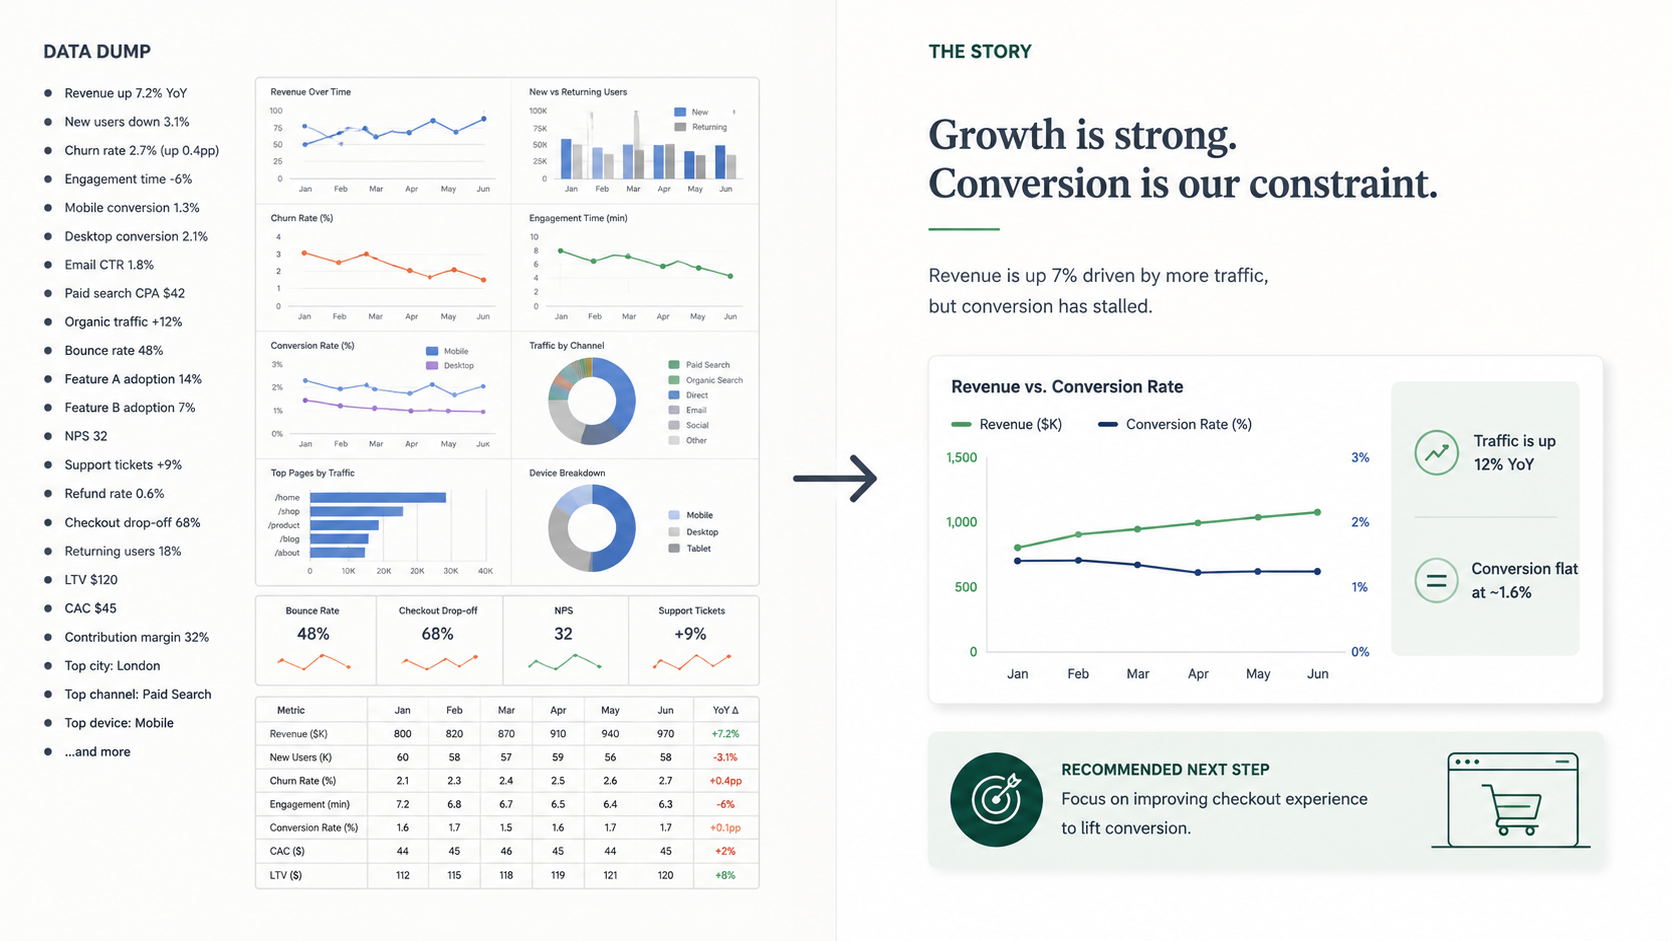
At the end of any analysis, you can either present a list of findings or build a story that drives a decision. A decision story explains what changed, why it matters, and what to do next.
Audience Analysis
Before building the story, answer three questions:
- Who makes the decision? Even if ten people are in the room, usually only one or two can actually act. Build your story for them.
- What do they already believe? This becomes your Situation — the shared starting point your story builds on.
- What action do you want them to take? This becomes your Resolution — the recommendation the analysis should produce.
The gap between #2 and #3 is what your data has to bridge.
The SCR Framework
The simplest and most effective story structure is Situation → Complication → Resolution (SCR).
Situation. What is the current state? What background does the audience already know? Start with facts they already accept.
Complication. What changed? What is the problem? What are the risks if nothing is done? This is where you show why action is needed.
Resolution. What does the data show, and what do you recommend? This is the ask.
Think of it this way: Situation is what the stakeholder believes now. Resolution is where you want them to end up. Complication, supported by your data, is the bridge. Before you build your presentation, write down these three parts clearly. If you cannot, the analysis is not ready.
Example: Explaining a Revenue Miss to the CMO
Recall the opening of this part: the CMO sat through fifty slides and asked, “So what? What should we do?” Here is what she actually needed.
The CMO has to decide where to shift next quarter’s budget. That’s the decision the analysis should change.
Situation. Revenue is growing, and new customer acquisition is on track.
Complication. Q4 finished below plan. The gap comes from existing customers: purchase frequency among the cohort acquired during Q2 promotions dropped sharply, pulling down existing-customer revenue.
Resolution. This is not a broad acquisition problem. Keep acquisition spend stable, but launch a reactivation campaign for the Q2 promotional cohort and tighten future promotion targeting.
The story is no longer just ‘here are the metrics.’ It is ‘the revenue gap is a retention problem, not an acquisition problem, and the next action is reactivation.’ That is the version the CMO can actually act on.
Visualizing the Story
Once the story is clear, pick only the charts needed to support it. Give each chart a title that states the message, not just the metric. The goal is not to show everything you analyzed. The goal is to make the decision easy to see.